Lecture Clips
 QAC 201 Introduction
This video, Introduction, provides a brief overview of the course. More detailed information will be presented to you during our first lecture session on Friday. (2 minutes)
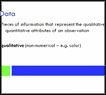 Data Architecture
A data set (or dataset) is a collection of information, usually presented in tabular form. Each column represents a particular variable. Each row corresponds to a given member (or observation) within the data set. This clip on Data Architecture further defines rows (observations) and columns (variables) and provides concrete examples of each. (7 minutes)
 Literature Review (Part 1) (Part 2) (Part 3)
These videos describe the nature and content of primary source journal articles. They are aimed at convincing students about the importance of conducting a literature review before initiating a research project. (6 minutes, 24 minutes, and 6 minutes)
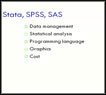 Software
The use of syntax in the context of statistical software is a central skill that greatly expands a student’s capacity not only for statistical application, but for engaging in deeper levels of quantitative reasoning about data. This year, we provide resources for the use and translation of four commonly used statistical software packages across the natural and social sciences (SAS, Stata, SPSS and R), focusing on the commonality and patterns that will provide you with a powerful, general viewpoint for data management and statistical analysis. This video on statistical software presents a brief overview. (2 minutes)
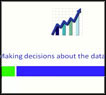 Data Decisions (Rows and Columns)
Although some common statistical software packages have developed a point and click interface, we will employ only the logic syntax-based approaches to statistical computing in an effort to help you fully engage in the decision making process of scientific inquiry. This video on data decisions will get you thinking about some choices you will need to make when working with your data. (8 minutes)
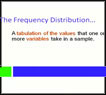 Data Decisions (Frequency Distributions)
Examining frequency distributions for each of your variables is key to guiding the decision making process. (5 minutes)
 Data Decisions (Management)
This video provides examples of common decisions and data management steps that you will need to take with your data. (27 minutes)
Univariate Graphing

Descriptive statistics are used to describe the basic features of individual variables. Also known as univariate analysis, descriptive statistics summarize one variable at a time, across the observations in your data set. For quantitative variables, there are three major characteristics that we tend to look at:
- the shape of the distribution
- the central tendency of the distribution
- the dispersion (or spread) of the distribution
The following Video Clip describe these and provide additional information on how descriptive statistics can be examined graphically. (11 minutes)
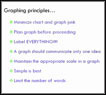 Graphing Rules
When graphing your data, it is important that each graph provides clear and accurate summaries of the data that do not mislead. This video provides a few basic graphing guidelines to help you accomplish this goal. (3 minutes)
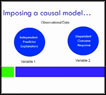 Bivariate Graphing
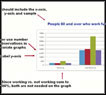
We will be asking you to “impose” a causal model on your research question, despite the fact that you will not be able to directly evaluate a causal relationship. This video defines the two types of variables you will be identifying and shows you how this decision will guide the kinds of graphing you do and the kind of statistical tests that you will ultimately use. It also provides examples of how statistical output can be displayed in bivariate graphs (i.e. graphs displaying the association between two variables at a time). (17 minutes)
 Common Graphing Mistakes
Graphs that seem to provide important information can in fact be erroneous. Watch as this visually appealing graph is deconstructed and modified to better present the association of interest. (3 minutes)
 The Big Idea Behind Inferential Statistics; and the Big Idea Continued
Thus far, we have focused on descriptive statistics. Through our examination of frequency distributions, graphical representations of our variables, and calculations of central tendency and spread, the goal has been to describe and summarize data. The 9 video clips in this lesson will now introduce you to inferential statistics. In addition to describing data, inferential statistics allow us to directly test our hypothesis by evaluating (based on a sample) our research question with the goal of generalizing the results to the larger population from which the sample was drawn.
In these two clips, you will learn about sampling distributions. A sampling distribution is a distribution of all possible samples (of a given size) that could be drawn from the population. If you have a sampling distribution meant to estimate a mean (e.g. the average age of a population), this would be represented as a distribution of frequencies of the mean age for consecutive samples drawn from the population. Although we ultimately rely on only one sample, if that sample is representative of the larger population, inferential statistical tests allow us to estimate (with different levels of certainty) a mean (or otherparameter such as a standard deviation, proportion, etc.) for the entire population. This Big Idea is the foundation for each of the inferential tools that you will be using this semester. (10 minutes and 14 minutes)
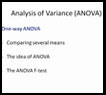 ANOVA
ANOVA
The inferential tests that you will be using this semester follow the same reasoning, but include Analysis of Variance (ANOVA), Chi Square Test of Independence, Pearson Correlation and Multiple and Logistic Regression. We will start with ANOVA which is used to test whether the means (quantitative DV) of two or more groups (categorical IV) are statistically different from each other. The null hypothesis is that there is no difference in the mean of the quantitative variable across groups (categorical variable), while the alternative hypothesis is that there is a difference. This ANOVA clip provides an overview. (7 minutes) 
Chi Square
A chi-square test of independence compares frequencies of one categorical variable (IV) for different values of a second categorical variable (DV). The null hypothesis is that the relative proportions of one variable is independent of the second variable. The alternate hypothesis is that the relative proportions of one variable are associated with the second variable. This Chi Square clip presents how this inferential tool helps you to evaluate whether or not there is an association between two categorical variables. (24 minutes)
Regression
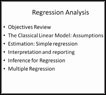
The general purpose of multiple regression is to learn more about the relationship between several independent or predictor variables and a dependent variable. Multiple regression procedures are very widely used in research. In general, this inferential tool allows us to ask (and hopefully answer) the general question "what is the best predictor of ...". For example, educational researchers might want to learn about the best predictors of success in high-school. Sociologists may want to find out which of the multiple social indicators best predict whether or not a new immigrant group will adapt to their new country of residence. Biologists may want to find out which factors (e.g. temperature, barometric pressure, humidity, etc.) best predict caterpillar reproduction. In this clip on Regression, we present the basic intuition behind regression analysis. (30 minutes)
Confounding and Confounding and Multivariate Models
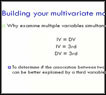
In statistics, a confounding variable (also confounding factor, lurking variable, a confound, or confounder) is an extraneous variable in a statistical model that correlates (positively or negatively) with both the dependent variable (outcome) and the independent variable (predictor). We need to “control for” these factors to avoid incorrectly believing that the dependent variable is associated with the independent variable. Confounding is a major threat to the validity of inferences made about statistical associations. In the case of a confounding variable, the observed association with the dependent variable should be attributed to the confounder rather than the independent variable. In science, we test for confounders by including those “3rd variables” in our statistical models that may explain the association of interest. In other words, we want to demonstrate that our association of interest is significant even after controlling for potential confounders. In the following 2 clips, confounding is described in the context of study design and we demonstrate how to test and evaluate confounding within a multivariate model. (8 minutes and 26 minutes)